
As described in my other BLOG posts, I have two KD9SV reversible BOGs (Beverage On Ground) oriented along NE-SW and NW-SE directions. They are both 300′ long (rabbit proofed 12 AWG wire with two parallel conductors) and lay directly on the ground (rocky soil; low conductivity). On 160 m band I use KD9SV preamplifier to bring the signal to approximately the same level as my inverted L antenna (inv-L). I do not have such preamplifier for 80 m at the moment (but use the built-in preamp2 setting on the K4). In addition to my BOGs being perhaps a bit too long for 80 m (but note that they still work on 60 m), this lack of external preamp may have reduced BOG performance on 80 m when the band is quiet (as it was during this test). Naturally ionospheric conditions (arrival angles, polarization) have also contributed to the results. There were no major thunderstorms nearby during these tests so QRN was minimal. If storms were located away from the direction of BOG, its RX performance over inv-L (approximately omnidirectional) would improve significantly. Since FT8 uses 15 second RX/TX window, the results obtained represent average signal to noise ratio (SNR) over that period. Note that inv-L antenna is mostly vertical polarization whereas the BOGs are horizontal and collect signals very efficiently at low arrival angles. Here are the results collected using the multi program (described in other BLOG posts) for 80 m band (EU direction / NE; only EU stations included):
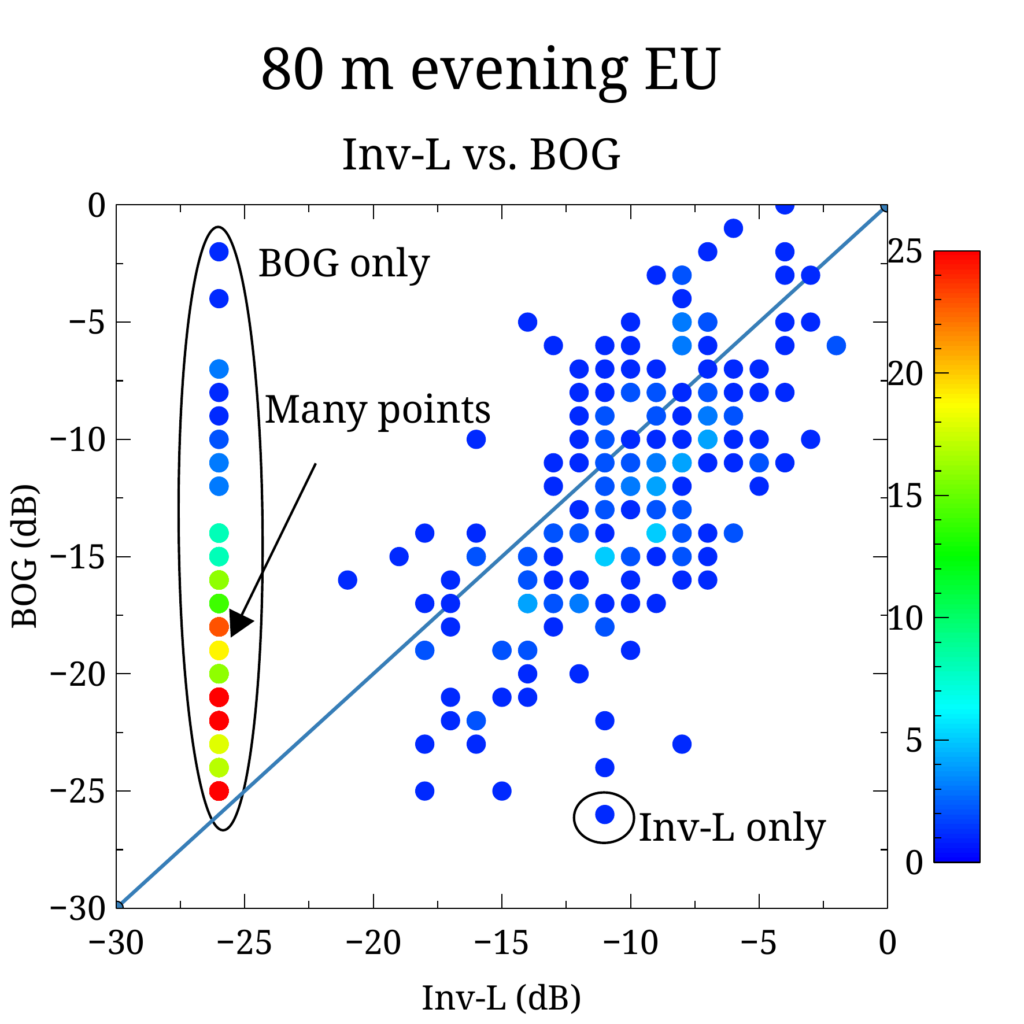
Note that the multi program reads the audio data simultaneously from the two RXs in my K4, which are connected to inv-L and BOG antennas. The audio data is processed by two separate JT9 processes and aggregated into single WSJT-X instance. The X-axis represents SNR of the decodes obtained on inv-L and the Y-axis the corresponding SNRs on BOG. Each point represents a simultaneous decode from the two antennas. With this axis choice, the points above the straight reference line indicate decodes where BOG SNR was better than inv-L and vice versa for the points below the line. If the given antenna could not decode the signal, this was arbitrarily chosen as SNR -26 dB (below the -25 dB FT8 decode level). The colors indicate how many decode pairs landed on the same point (scale shown on the right; see “Many points” on the graph). Interestingly BOG was able to decode everything that inv-L could but with only one exception (inv-L only). On the other hand, BOG was able to receive many decodes that inv-L could not (BOG only). The intermediate group of blue points below the straight line (where inv-L had better SNR) mainly consisted of one station (calling CQ forever) that was somehow always received better on inv-L – possibly due to the band conditions. While not always giving best SNR, BOG was able to decode significantly more stations than inv-L could. Note that there have been situations where a QSO could not have been completed by using just one antenna: one decode was obtained only on inv-L and the other only on BOG. This can be achieved with the multi program, which automatically picks up the strongest decode from the two receivers / antennas.
Here is the corresponding data collected on 160 m band:
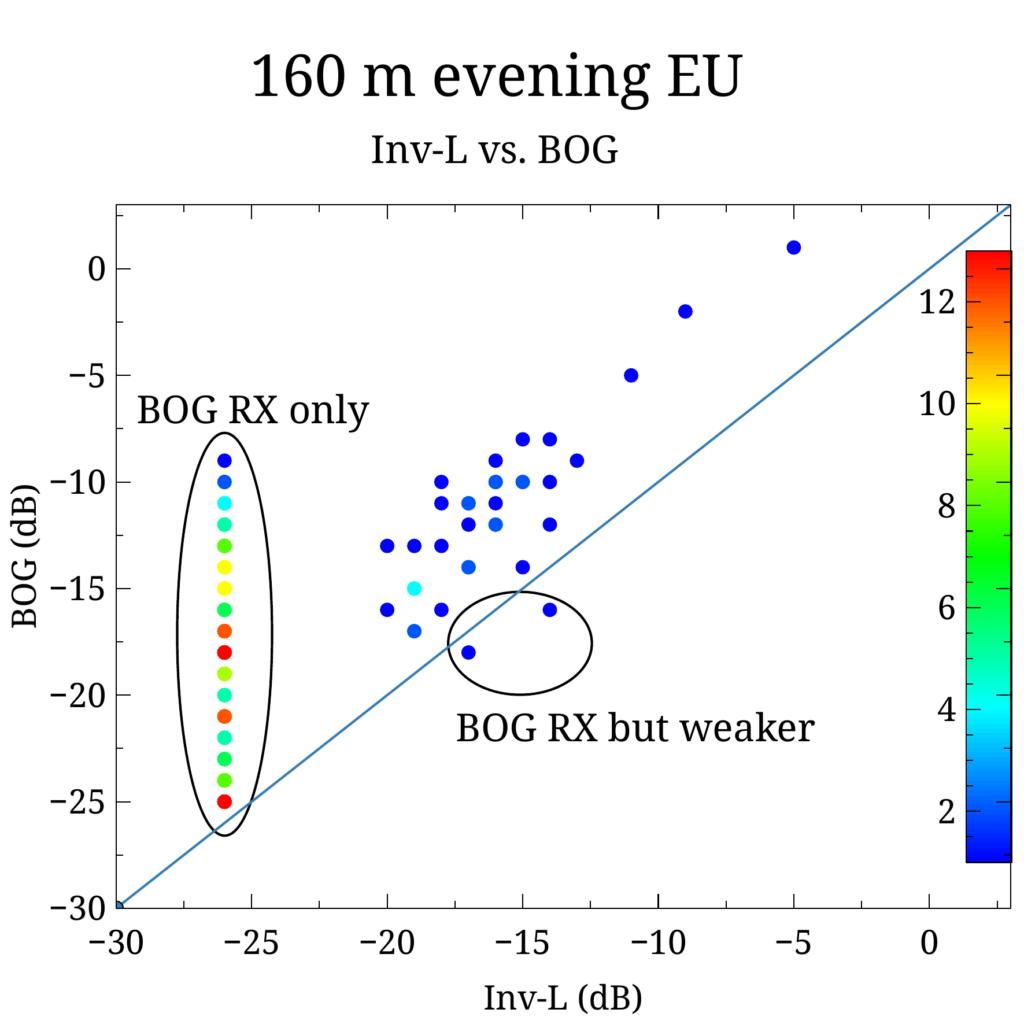
While this dataset is smaller than for 80 m band, the results here show a much clearer trend. A large number of stations could not be decoded on inv-L (BOG RX only) and those that are received on both give better SNR on BOG (i.e., points above the reference line). Only two decodes had slightly better SNR on inv-L than BOG and inv-L did not hear any stations that BOG could not. The RX performance of BOG on 160 m band is excellent!